IDM PowerTips
Quickstart guide: Using the integrated debugger
UEStudio provides extensive tools for debugging applications for the Microsoft Windows family of operating systems. With UEStudio you are able to configure/integrate external debuggers as well as use the integrated debugger. Keep reading to see how to utilize the power of UEStudio’s integrated debugger.
Quickstart Guide: Using the Integrated Debugger
Notes: The integrated Debug support is used with the Microsoft c/c++ compiler
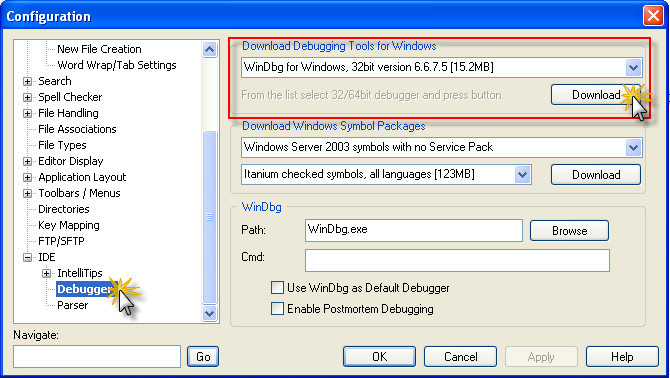
In order to use the integrated debugger, you must have WinDebug v6.6 or higher installed. If you do not have this installed, you may download it from Advanced->Configuration->IDE->Debugger. Select the appropriate version (dependant upon your system) and click on the Download button
The actual process of “how to” debug an application is not covered in the scope of this powertip. This powertip assumes some knowledge of debugging. You can learn more about how to debug an application from the following. http://www.microsoft.com/whdc/devtools/debugging/default.mspx
Step 1: Create (or open) your project
Create a new project. For information about creating a project within UEStudio, please click here to learn more.
If you already have a project (written in C) which you would like to use a debugger with, please open the project instead of creating a new one.
Step 2: Configuring your project
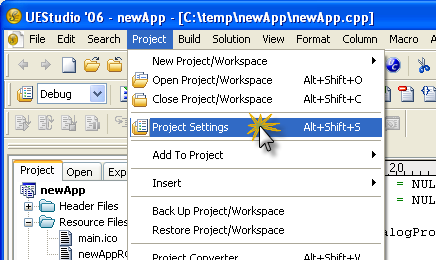
Once you’ve created your project, go to the project settings dialog in the Project Menu.
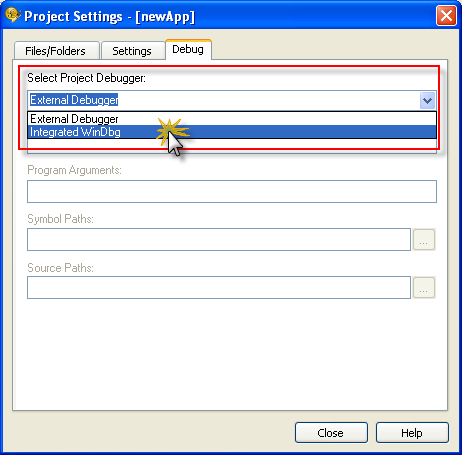
Click on the debug tab, then select the “Integated WinDBG” in the “Select Project Debugger” dropdown.
Note:
If UEStudio cannot find your WinDebug installation, you will be prompted to browse to the location of the windbg.exe.
If you do not have WinDebug installed, clicking cancel should take you to the Debug dialog in Advanced->Configuration->IDE->Debugger. You can select the Debugger for your system and Download it. After the download is complete, install the debugger by running the installation exe.
You can configure additional items in the Working Directory, Program Arguments, Symbol Paths and Source Paths. These items are not needed in order to run the Debugger, so they are not covered in the scope of this Quick Start guide. For additional information regarding the use of these options, please see the Help.
Step 3: Set a Breakpoint
Open the file containing the code for which you would like to use the debugger with.
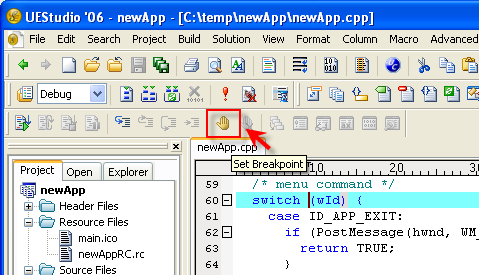
Set the Breakpoint by clicking on the Set Breakpoint icon in the debug toolbar.
You will use the BreakPoints to help you determine what is happening at a particular point in your application. Note: You can also set breakpoints in the Build->Debug Menu or from the right click context menu.
After you set the breakpoint, you will see the breakpoint symbol appear on the left.
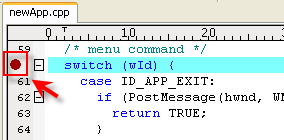
You can remove the breakpoint by using the Remove Breakpoint option.
As the code is executed, when a breakpoint is hit, you will see a yellow arrow on top of the Breakpoint.

Step 4: Start Debugging
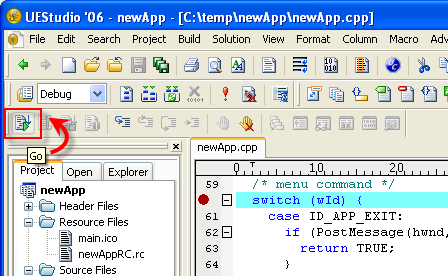
To start debugging, click on “Go” in the debug toolbar or in Project->Debug->Go.
UEStudio will Build the project, and will launch the application in Debug mode.
The previously disabled icons on the Debug toolbar are now active.
As this Powertip assumes some knowledge of debugging, the remainder of this powertip is written to inform you of the debugging tools available in UEStudio. The actual process of debugging is not covered in the scope of this powertip. You can learn more about how to debug an application from the following: http://www.microsoft.com/whdc/devtools/debugging/default.mspx
Step 5: Debugging tools
Below is a brief summary of the Debug Toolbar options.
| Go | Automatically starts the debugger and runs the application | |
| Restart | Ends a debugging session and then restarts | |
| Stop Debugging | Ends a debugging session | |
| Break | Pauses target execution and returns control to debugger | |
| Step Into | Executes code one statement at a time, following execution into function calls | |
| Step Out | Executes remaining lines of a function in which the current execution point lies | |
| Step Over | Executes the next line of code but does not follow execution through any function calls | |
| Run to Cursor | Resumes execution of code from the current statement to the selected statement | |
| Set Breakpoint | Adds breakpoint at current cursor location | |
| Remove Breakpoint | Removes breakpoint at current cursor location |
The Debugger Windows
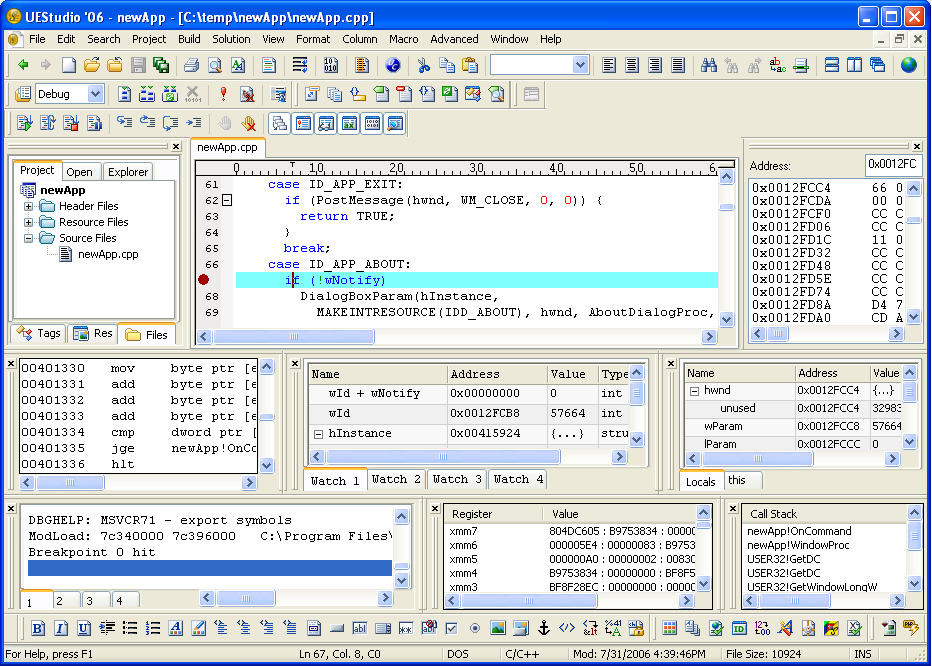
Enable the Debug Windows using the associated icons in the Debug toolbar. The Debug windows can be docked or un-docked and arranged in the configuration that best suits your needs. A brief explanation of the information contained in each window follows:
Call Stack Window:
The Call Stack Window lists all the active procedures or stack frames for the current thread of execution.
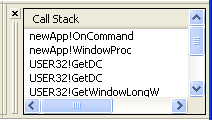
Variables Window:
The Variables Window shows all of the variables that are currently in scope and their resepective values.
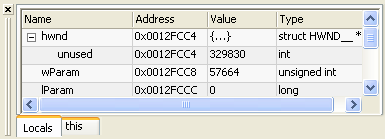
Watch Window:
The Watch Window shows the values for any variable(s) you type. You may also type expressions in the fields and they will be evaluated accordingly. (ie: wId + wNotify).
Double click in the name column for the field and type a value (or expression). The process must have been first ‘broken into’ in order to type in the field.

Registers Window:
The Registers Window shows the values contained in all of the CPU’s (or Processor’s) registers.

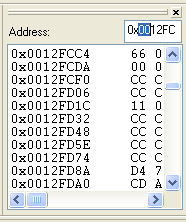
Memory window:
The Memory Window shows the contents of memory at the location and the areas around it. You can type a memory reference in the text field. The example below shows “0x0012FCC4”.
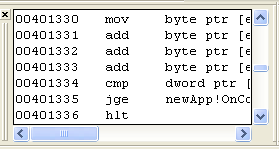
Disassembly Window:
The Disssembly Window allows you to view code bytes for the process being debugged, and the assembly instructions associated with them, at the current execution point.
Output Window:
The Output Window is not new to UEStudio. As you would expect, the Output Windows shows the output generated by the debugger during the debug process.

Step 6: Stop Debugging
To stop the debugger, click on the Stop debugging icon in the Debug toolbar.


